Sale!
Indicator Open Interest Chart
Original price was: $19.00.$7.00Current price is: $7.00.
An open interest chart visualizes the number of outstanding derivative contracts, such as options or futures, that have not yet been settled. It’s a key indicator in options and futures trading, reflecting market participation, liquidity, and trend strength. Higher open interest typically suggests greater market activity and liquidity, while declining open interest may indicate weakening momentum.
Description
An open interest chart visualizes the number of outstanding derivative contracts, such as options or futures, that have not yet been settled. It’s a key indicator in options and futures trading, reflecting market participation, liquidity, and trend strength. Higher open interest typically suggests greater market activity and liquidity, while declining open interest may indicate weakening momentum.
Here’s a more detailed breakdown:
What is Open Interest?
- Open interest represents the total number of outstanding derivative contracts that are still open and have not been settled (either by delivery or offset).
- It’s a measure of market participation and liquidity, with higher open interest generally indicating greater interest and activity in a particular contract.
How is it visualized on a chart?
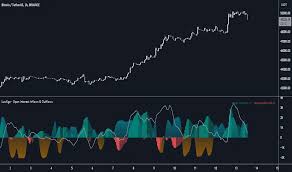
- Open interest is plotted on a chart, often as a line graph or a series of circles.
- The height or size of the plot (line or circle) represents the value of open interest at a given point in time.
- In some charts, changes in open interest (increase or decrease) are color-coded to indicate market sentiment (e.g., green for increasing, red for decreasing).
What can you learn from an Open Interest Chart?
-
Market Participation:Higher open interest suggests more traders are involved in the market for that specific contract, indicating stronger interest and potentially more liquidity.
-
Trend Strength:Increasing open interest, especially when aligned with price movements, can confirm the strength of a trend.
-
Liquidity:Higher open interest implies greater liquidity, making it easier to enter and exit positions.
-
Market Sentiment:Open interest can provide insights into market sentiment, with rising open interest often indicating bullish sentiment and falling open interest potentially suggesting bearish sentiment.
-
Potential Breakout Zones:High open interest relative to previous periods can sometimes indicate a sideways movement and preparation for a breakout.
-
Position Reduction:Significant drops in open interest can indicate traders are closing their positions, potentially leading to mean reversion opportunities.
How to interpret the chart:
-
Rising Open Interest:Generally suggests increasing market participation, potentially confirming a strong trend.
-
Falling Open Interest:May indicate weakening momentum, traders exiting positions, or a potential consolidation phase.
-
High Open Interest:Can be a sign of strong market participation and liquidity but its impact should be analyzed in context with price movements.
-
Color-Coded Changes:Green (or other colors indicating an increase) can suggest money flowing into the market, while red (or other colors for decrease) may indicate money leaving the market.
-
Integration with other indicators:Open interest is most effective when combined with other technical analysis tools like price and volume, as well as fundamental analysis.


Reviews
There are no reviews yet.