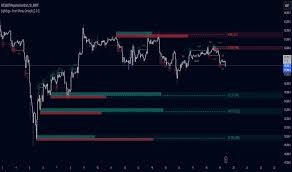
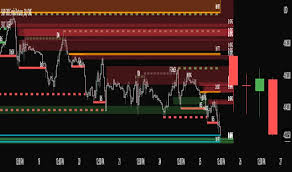
Indicator MONEY ALGORITHM for TradingView
Original price was: $15.00.$8.00Current price is: $8.00.
The term “MONEY ALGORITHM” in the context of TradingView usually refers to indicators or strategies that attempt to identify and capitalize on the trading patterns of “smart money” or large institutional investors. These indicators often incorporate elements like volume analysis, price action, and multi-timeframe analysis to detect accumulation and distribution phases before significant price movements.
Description
The term “MONEY ALGORITHM” in the context of TradingView usually refers to indicators or strategies that attempt to identify and capitalize on the trading patterns of “smart money” or large institutional investors. These indicators often incorporate elements like volume analysis, price action, and multi-timeframe analysis to detect accumulation and distribution phases before significant price movements.
-
Smart Money:Refers to institutional investors, market makers, and large players with the ability to influence price movements.
-
Liquidity Hunts:Large players often target areas of high liquidity (where many stop-loss orders are placed) to trigger price movements and capitalize on the resulting volatility.
-
Accumulation and Distribution:Identifying periods where smart money is quietly buying (accumulation) or selling (distribution) before a major price move.
-
Volume Analysis:Analyzing volume spikes, price-volume dynamics, and momentum to gauge institutional activity
-
Divergence Detecion:Identifying divergences between price and volume or other indicators, which can signal potential trend reversals.
-
Trend Following:Many of these indicators also incorporate trend-following elements, using moving averages or other trend filters to identify the overall direction of the market.
-
Dynamic Support and Resistance:Many indicators use adaptive support and resistance levels that adjust to changing market conditions.
-
Liquidity Zone Identification:Highlighting areas where large orders are likely to be placed.
-
Buy/Sell Signal Generation:Providing visual or audible buy/sell signals based on the identified patterns.
-
Alerts and Visualizations:Many indicators offer customizable alerts and visual aids to help traders identify opportunities and manage risk.
-
Customizable Settings:Allowing traders to adjust parameters like sensitivity, risk management, and visualization options.Multi_Timeframe Analysis:Analyzing price action and volume on multiple timeframes to get a broader perspective of market dynamics, says PhenLabs on TradingView.
-
Smart Money Seup 07:Detects liquidity hunts and smart money entry points, according to TradingView.
-
Support and Resisance Power Channel Indicator:Measures buying and selling pressure within support and resistance zones.


Reviews
There are no reviews yet.