“Hyperboloid Multi EA” has been added to your cart. View cart
Sale!
Indicator gv23 for TradingView
$17.00 Original price was: $17.00.$9.00Current price is: $9.00.
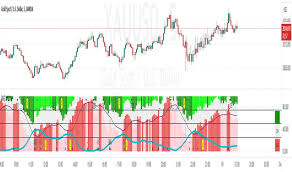
The indicator “gv23” for TradingView is a script that analyzes price movements using different types of moving averages, allowing users to customize its appearance and highlight price crossings. It provides educational insights into price action analysis with customizable settings for various moving average types, lengths, and visual parameters.
Description
The indicator “gv23” for TradingView is a script that analyzes price movements using different types of moving averages, allowing users to customize its appearance and highlight price crossings. It provides educational insights into price action analysis with customizable settings for various moving average types, lengths, and visual parameters.
Key Features and Functionality:
-
Moving Average Analysis:The indicator focuses on analyzing price movements using moving averages, which are smoothed lines representing average price over a specific period.
-
Customization:Users can tailor the indicator’s behavior by adjusting inputs like moving average type (e.g., simple, exponential, weighted), length, and visual settings.
-
Highlighting Price Crossings:The indicator can be configured to highlight when the price crosses above or below the moving average lines, potentially indicating buy or sell signals.
-
Color Coding:It can change colors based on the direction of price movement (e.g., green for bullish, red for bearish), further assisting in identifying trends and potential trading opportunities.
-
Educational Purposes:its for educational purposes, under the Mozilla Public License 2.0, allowing users to explore and learn from its code.
Potential Applications:
-
Trend Identification:The indicator can help traders identify the overall direction of the market trend (uptrend or downtrend) based on moving average crossovers.
-
Buy/Sell Signals:Traders can potentially use the price crossing signals as buy or sell opportunities, although this should be done with proper risk management and in conjunction with other indicators and analysis techniques.
-
Customization:The customizable nature of the indicator allows users to adapt it to their specific trading strategies and preferences.
Be the first to review “Indicator gv23 for TradingView” Cancel reply
Related products
-
Sale!

Hyperboloid Multi EA
$13.00Original price was: $13.00.$5.00Current price is: $5.00. Add to cart -
Sale!

Happy Gold V 2.0
$12.00Original price was: $12.00.$5.00Current price is: $5.00. Add to cart -
Sale!

Finance Scalper Bot
$15.00Original price was: $15.00.$8.00Current price is: $8.00. Add to cart -
Sale!

Indicator 20-Multi-Indicator Expert System for TradingView
$17.00Original price was: $17.00.$6.00Current price is: $6.00. Add to cart


Reviews
There are no reviews yet.