Indicator for TradingView
Original price was: $17.00.$6.00Current price is: $6.00.
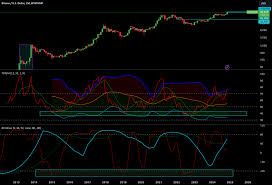
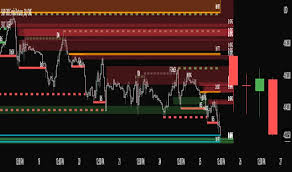
TradingView indicators are mathematical calculations or algorithms applied to price data to help traders identify potential trading signals, patterns, and market momentum. They transform raw price data into visual representations like lines, histograms, or other shapes on price charts, aiding traders in making informed decisions about when to buy or sell.
Description
TradingView indicators are mathematical calculations or algorithms applied to price data to help traders identify potential trading signals, patterns, and market momentum. They transform raw price data into visual representations like lines, histograms, or other shapes on price charts, aiding traders in making informed decisions about when to buy or sell.
-
Tool:TradingView indicators are fundamental tools for technical analysis, helping traders analyze price movements, identify trends, and spot potential trading opportunities.
-
Visual Representation:They convert complex price data into easily understandable visual elements on charts, making it simpler to interpret market behavior.
-
Signal Generation:Indicators can generate buy and sell signals based on pre-defined rules and parameters, helping traders time their entries and exits.
- Smooth out price data to identify trends and potential support/resistance levels
- Measure the momentum of price movements and identify overbought or oversold conditions.
- Analyze trading volume to understand the strength of price movements and identify potential trend reversals.
- Measure the degree of price fluctuations and help assess risk.
- Help identify and follow the direction of market trends.
.
-
.
A tool that identifies potential support and resistance levels based on Fibonacci ratios. -
.
An indicator that shows trading activity at different price levels over a specific period.
- Open a chart: Choose the financial instrument and timeframe you want to analyze on TradingView.
- Access the indicator menu: Click the “Indicators” button on the top toolbar of the chart.
- Select an indicator: Search for and add the desired indicator from the list.
- Customize: Adjust the indicator’s settings (e.g., period, color, style) to fit your preferences and trading strategy.
- Analyze and interpret: Use the visual representation of the indicator to identify patterns, signals, and potential trading opportunities.
- Combine with other tools: Don’t rely on a single indicator; combine them with other technical analysis tools and price action analysis for a more comprehensive view of the market.


Reviews
There are no reviews yet.