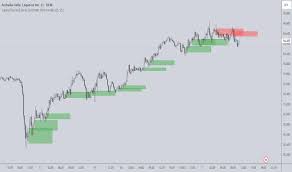
Indicator Candle Zone Price for TradingView
Original price was: $12.00.$6.00Current price is: $6.00.
A TradingView indicator to visualize price levels within a candle’s range based on a specified percentage is the “CAP” indicator. This indicator calculates a price level at a given percentage of the candle’s high-low range (e.g., 50% for the midpoint) and plots it as a horizontal line. Additionally, the “Titan Wick Zone” indicator highlights buy and sell zones based on candlestick wicks, helping to identify potential support and resistance areas.
Description
A TradingView indicator to visualize price levels within a candle’s range based on a specified percentage is the “CAP” indicator. This indicator calculates a price level at a given percentage of the candle’s high-low range (e.g., 50% for the midpoint) and plots it as a horizontal line. Additionally, the “Titan Wick Zone” indicator highlights buy and sell zones based on candlestick wicks, helping to identify potential support and resistance areas.
- Functionality: Calculates the price level at a user-defined percentage within each candle’s range (e.g., 25%, 50%, 75%).
- Calculation:
Price = Low + (Percentage Level / 100) * (High - Low). - Averaging: Can average these price levels over a specified number of past candles.
- Visualization: Plots a horizontal line at the calculated average price level, spanning from the specified number of candles ago to the current candle.
- Functionality: Visually distinguishes buy and sell zones based on candlestick wicks.
- Buy Zone: Fills the area below the candle body to the wick low in green, indicating potential support.
- Sell Zone: Fills the area above the candle body to the wick high in red, indicating potential resistance.
- Opacity Control: Allows for adjustable opacity to maintain chart clarity.
-
1. Add the Indicator:Search for “Candle Average Price” or “Titan Wick Zone” in the TradingView indicator library and add it to your chart.
-
2. Customize:Adjust the settings, such as the percentage level for the “Candle Average Price” indicator and the opacity for the “Titan Wick Zone” indicator, to suit your preferences and trading style.
-
3. Analyze:Use the visualized price levels and wick zones to identify potential support and resistance areas, entry and exit points, and areas of price rejection.


Reviews
There are no reviews yet.