Sale!
Indicator MELONA – RSI STRATEGY for TradingView
Original price was: $12.00.$9.00Current price is: $9.00.
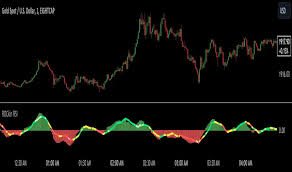
“MELONA OB STRATEGY 6TH UPDATE” is a TradingView indicator developed by “3dots” that incorporates the Relative Strength Index (RSI) alongside other tools for analyzing market trends and identifying trading opportunities.
Description
“MELONA OB STRATEGY 6TH UPDATE” is a TradingView indicator developed by “3dots” that incorporates the Relative Strength Index (RSI) alongside other tools for analyzing market trends and identifying trading opportunities.
Utilizing the “MELONA” indicator with an RSI strategy on TradingView
- Adding the indicator to your chart:
- Search for and add “MELONA OB STRATEGY 6TH UPDATE” by 3dots to your TradingView chart.
- RSI-based trading strategy concepts:
- Overbought/Oversold: A common approach is the 70-30 RSI strategy, where buying when RSI dips below 30 (oversold) and selling when it rises above 70 (overbought) is considered.
- Mid-range Signals: The 60-50 RSI strategy suggests buying when RSI crosses above 50 after being below, and selling when it crosses below 50 after being above.
- Confirmation with Candlestick Patterns: Combining RSI signals with candlestick reversal patterns, such as bullish engulfing or pin bars, can enhance the accuracy and timing of entries and exits.
- Backtesting and Optimization:
- Backtesting on TradingView using the Bar Replay Tool allows you to simulate past market conditions and analyze your strategy’s historical performance.
- Optimizing the indicator’s parameters (including the RSI period and overbought/oversold levels) to identify the best settings for your chosen asset and timeframe is crucial.
- Implementing a strategy:
- Pine Script allows you to convert an indicator into a strategy by replacing
indicator()withstrategy()and adding order placement commands (e.g.,strategy.entry()) triggered by the indicator’s conditions.
- Pine Script allows you to convert an indicator into a strategy by replacing
- Setting up alerts:
- You can set up alerts on TradingView to receive notifications when specific RSI conditions (e.g., crossing a certain level) are met, allowing you to react promptly to market movements.
Note: Always remember that past performance is not indicative of future results, and trading involves inherent risks.


Reviews
There are no reviews yet.